
The Google Chart API is a great way to dynamically create chart and graph images for any non-static data you might want to display to your visitors, such as stats for a runner’s training log.
Although you can use your own server-side solution for generating charts, using PHP’s GD Image Processing Library or even a fancy chart library like pChart, this can increase the drain on your server’s resources. Client-side solutions that utilize the canvas element and jQuery or Flash can be very nice and easy to use, but may slow down the browser if there are a lot of charts.
Google Charts offers a nice trade-off; by using their service you offload the processing and bandwidth and get back a simple PNG image, but you must learn to use the API. Additionally, there’s also the risk that the service may throttle you, even if there’s no current usage limit.
Problems specifying Axis Ranges – Data points are not changed!
The API for Google Charts essentially consists of passing different query string parameters and their values and getting back a PNG-format image. As a result of this, passing in parameters is a bit quirky, and information in the API guide is a bit sketchy in this respect.
One such example with quirky behaviour is properly setting the axis’ ranges, or scales, of a chart. By default, all charts are set up on a 100×100 grid. It would seem that by changing the axis range, these values will be adjusted accordingly, affecting the position of any data points you’ve plotted.
But this isn’t the case; instead, changing the axis range with the chxr parameter only adjusts the position of any axis labels you might have, and does not affect the position of data points. Instead, data points will continue to be plotted as if they were on a 100×100 grid.
Illustrating the problem
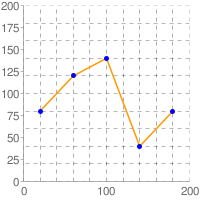
The following examples illustrate this point. We plot a set of points, {(10,40),(30,60),(50,70),(70,20),(90,40)} using an X-Y line chart. The first chart illustrates the points on the default grid of 100×100. Because axis labels/positions have not been specified, the chart has been filled with default axis labels, which are values in the respective positions.

URL: http://chart.apis.google.com/chart?chs=200x200&cht=lxy&chd=t:10,30,50,70,90|40,60,70,20,40&chxt=x,y&chg=10,10&chm=o,0000FF,0,-1,5,0In this case, the points are plotted in the correct positions. (Points have been highlighted with markers for clarity and grid lines spaced 10 units apart)
However, if we simply change the axis ranges by specifying the chxr parameter to be chxr=0,0,200|1,0,200, the axis labels change, but the data points are not properly scaled:
URL: http://chart.apis.google.com/chart?chs=200x200&cht=lxy&chd=t:10,30,50,70,90|40,60,70,20,40&chxt=x,y&chg=10,10&chm=o,0000FF,0,-1,5,0&chxr=0,0,200|1,0,200This is further evidenced by the grid line spacing; though it’s still set to 10 units, the lines would appear to be 20 units apart in the above graph. This means that internally, the chart is still using a 100×100 grid. So, how do we fix that?
Plotting data properly with axis ranges
The documentation would benefit from being clearer in this respect.
In order to properly scale data, you must use data scaling whenever you adjust the axis ranges to non-default values.
For the above example, since we have set both axis ranges to 0-200, we must set the data scale of both data sets (X and Y values) to 0-200 as well. We accomplish this by setting the chds like so:
chds=0,200,0,200The resultant graph is now as expected for the given data points:

URL: http://chart.apis.google.com/chart?chs=200x200&cht=lxy&chd=t:10,30,50,70,90|40,60,70,20,40&chxt=x,y&chg=10,10&chm=o,0000FF,0,-1,5,0&chxr=0,0,200|1,0,200&chds=0,200,0,200(Curiously, grid lines are still placed 10 units apart according to an “internal” 100×100 grid.)
I couldn’t find anything clear in the documentation about this, but instead found some helpful threads on the Google Groups for their Charts API that aided me in figuring out exactly how this all works.
Clear as mud?
There are still some things I’m not clear about, such as what data scaling is actually supposed to mean, and why simply changing axis ranges does not properly scale data in the first place. Additionally, the data formats page specifies numerous other ways of specifying data in more compact, encoded forms, but these formats do not seem to support data scaling. Does that mean these formats are confined to a 100×100 grid?
I haven’t had the time to fully experiment with the API, but hopefully will have time to learn. In the meantime, I hope you found this information useful. If you have some information I haven’t presented here, please don’t hesitate to comment below!
Note: The information and graph images here reflect the state of the Google Chart API as of the date of publication. (2008-11-06)
Great post. I have wasted half a day working on scaling and grid lines. Definitely clear as mud 🙂
Thanks for putting this online!
Nice tip. Now I understand.
Thank you so much, you just saved me so much work!!
Thank you for writing this. I’ve just spent a couple of hours trying to work it out.
Great post, at least put me in the right direction and realized I wasn’t going crazy
whoever wrote the api documentation should need fired asap
This didn’t work for me which is why I stumbled upon this page. ANy other pointers? This is my data. Note the position of highest dat apoint (390).
http://chart.apis.google.com/chart?cht=bhs&chs=800×300&chd=t:160,76,70,27,390&chds=0,390&chxt=x,y,x,y&chdl=No. of Deployments|Deployment Type&chxl=1:|QA|TestIntegration|PostDeploymentSupport|Prod|Code Review|2:|Number of Deployments|3:|Type of Deployment&chxp=2,50|3,30&chxr=0,0,390&chxs=0,000000,11|1,000000,11|2,AA0066,13|3,AA0066,13&chg=30,10&chm=N*f*,000000,0,-1,11,&chco=&chts=000000,15&chbh=a
Hi, While searching and doing Hit and trial for above graph I found that if I rmeove the ‘chbh=a’ parameter, the graph displayed properly. I found another link that claimed this as a bug – http://groups.google.com/group/google-chart-api/browse_thread/thread/981762ebe5661e8e and I feel the same.
Apparently as mentioned in above post, if I mention interval in ‘chxr’ parameter, it works fine.
Hi,
This does not work for 0,50,50,100.
chds=0,50,50,100
Can you please comment on this….
I spent about 2 hours searching for this. Thanks a lot, you saved me a day.
Thank you very much!
I was in trouble with same problem for days! Great work..
Thanks for posting this, was driving myself insane struggling with Google’s appalling documentation.
Excellent post! Solved a problem I was having using the radar charts. The API is wonderful but the documentation is horrendous
Thanks for the tip. But it didn’t work for my case. I have 2 lines and y axis could be up to millions.It scales only one line =(
chds:a works fine!=))) That’s for automatic scaling.
Thanks for the tip! I couldn’t do this and it was driving me nuts.
Thanks!
thanks…