We all know what debugging is – stepping through running code, line by line, inspecting variables and trying to figure out what’s wrong with your program while simultaneously tearing your hair out. However, usually when debugging Python code, the Python process is running locally on your system. What happens if you want to debug through code running on another server?
This is typically the case when working with OpenStack Swift, since the Swift-all-in-one (SAIO) instructions tell you to use a VM to run your Swift installation in, and a Vagrant VM provided by SwiftStack simplifies this. However, this means that the Swift code is not running locally; it’s running inside of your VM – so how do you debug into it?
Remote debugging aims to solve this by allowing you to inspect, trace and step through code running in a Python process on another machine. Setting this up requires some work, but is well worth the effort when debugging a non-trivial application running on a remote server or VM.
Purpose
This guide will help you get remote debugging working using PyDev and the LiClipse Python IDE. (If you are using PyCharm, it also supports remote debugging, and also uses PyDev, but I haven’t personally used it – but the instructions are likely to be similar)
For those of you from a Java background (like myself), remote debugging into a JVM is almost second nature, as usually you’re working with application servers/containers that run in a separate VM. In the case of Java, the typical remote debugging workflow had your IDE as the debugging client, and it connected to the remote “debug server”, which ran in the same JVM as the target code, and was enabled using the JVM debug options.
For remote debugging in Python using PyDev, the roles of client/server are somewhat reversed. For PyDev remote debugging, the debug server runs locally and is started by your IDE, and the remote Python process that you wish to debug acts as a client to connect to it. This means the target code that you want to debug must be modified so that it connects to your debug server.
Here’s a conceptual diagram of how Python remote debugging works:

Getting Started with LiClipse
I’ll be using LiClipse, a version of Eclipse that comes with PyDev pre-installed for this tutorial. I realize that Eclipse and other “heavy” IDEs aren’t that popular for Python development, however I’ve found LiClipse (via the PyDev plugin) to be quite useful for Python work. If you already know how to use Eclipse/LiClipse, you can skip this section.
You can install PyDev as an Eclipse Plugin, or just install LiClipse, which gives you everything. I recommend the latter. If you are using Homebrew Cask, it’s as simple as running:
$ brew cask install liclipseNote that you will need to have at least Java 7 installed since LiClipse is based on Eclipse, and Eclipse requires a JVM to run.
Once LiClipse is installed, open it, and when prompted, select a workspace location. (You probably don’t want to use the default of /Users/fabioz/Documents/LiClipse Workspace)
The workspace location is where LiClipse will store metadata related to preferences, projects, which files you have open, etc. I typically use something like ~/development/LiClipse Workspace
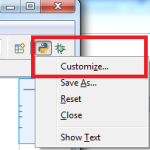
Once LiClipse is open, you’ll want to ensure the debug controls are always visible. This isn’t necessary but it makes things easier:
– Right-click Python icon in upper right corner -> Customize View
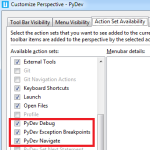
– Action Set Availability: Ensure all “PyDev*” entries are checked.
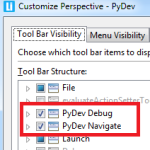
– Tool Bar Visibility: Ensure all of “PyDev Debug” is checked.
When asked for a Python interpreter, clicking auto-config should work. If it doesn’t, then will have to point to your Python installation, i.e. where your Python binaries are.
You’ll then want to import the Swift project/codebase into LiClipse. This can be done by importing it as a Git project, like so:
– PyDev Package Explorer: Right-click anywhere -> Import -> Git -> Next
– Projects from Git -> Existing Local Repository -> Next
– Add -> (Browse to your Swift git checkout folder) -> Check the Swift folder in the Search results -> Finish, Next
– Import as General Project -> Next -> Finish
You should then see the Swift git checkout in the PyDev Package Explorer Window.
Configuring Remote Debugging in PyDev/LiClipse
Now that you have PyDev/LiClipse setup, you can start remote debugging. As mentioned before, Python Remote Debugging works like this:
1. The Debug Server runs locally, i.e. on your developer machine.
2. The code you are remotely debugging must connect to this debug server.
3. After that, you are able to debug, trace and inspect code running remotely.
Because your local machine acts as the debug server, you must know its IP address so you can connect to it in step (2). If the remote code is running on a physically different server than your local machine, then you just need to know your local machine’s IP address.
However, if you are running a VM, as is recommended in the Swift-All-In-One instructions (and provided by the Vagrant SAIO), then it’s bit more complicated. In this case, the “remote” server is a VM running on your local/host machine. In this case, you should use the IP assigned to your local/host machine from the Virtual Machine Provider’s adapter. This is a virtual adapter that acts as a sort of bridge between your host machine and the virtual machine.
You can use your local machine’s “regular” IP address, but it might change (due to DHCP), while the virtual adapter IP address should not.
For example, if using VirtualBox, you can discover the host machine’s IP address by using ifconfig in OS X/Linux, or ipconfig in Windows. For OS X/Linux, look for the network adapter named “vboxnet*”:
$ ifconfig | grep -A 5 vboxnet
vboxnet0: flags=8943<UP,BROADCAST,RUNNING,PROMISC,SIMPLEX,MULTICAST> mtu 1500
ether 00:00:00:00:00:00
inet 192.168.8.1 netmask 0xffffff00 broadcast 192.168.8.255
In Windows, the network adapter name will have “VirtualBox” in it:
>ipconfig
...
Ethernet adapter VirtualBox Host-Only Network:

  Connection-specific DNS Suffix  . :
  Link-local IPv6 Address . . . . . : ***************************
  IPv4 Address. . . . . . . . . . . : 192.168.8.1
  Subnet Mask . . . . . . . . . . . : 255.255.255.0
  Default Gateway . . . . . . . . . :
In both examples above, the local/host machine IP is 192.168.8.1. Yours may be different. Remember this IP address, as you will use it to connect from the remote Python process to the debug server on your local machine.
Now you’ll need to start the PyDev debug server in LiClipse/Eclipse:
1. PyDev Menu -> Start Debug Server
2. Allow access through local Firewall if prompted.
3. The Console should pop up at bottom and show: “Debug Server at port: 5678”
This is the default port; you can change it in LiClipse Preferences.
4. Allow network access if prompted by OS/security settings.
You can also (optionally) switch to the Debug Perspective in LiClipse:
– Window -> Open Perspective -> Other -> Debug
– You can switch back to normal Python view using the buttons in the upper right corner.
– Here you can see the call stack, variables and their values and other state of the running program.
Next, you’ll need to copy over the PyDev debug source code to your VM. It’s needed so that a connection can be made to the debug server running on your local machine. The PyDev debug source is located within your LiClipse installation at a location like this:
{path to LiClipse}/liclipse/{liclipse version number}/liclipse/plugins/org.python.pydev_{pydev version number}/pysrcFor example:
/opt/homebrew-cask/Caskroom/liclipse/2.1.0/liclipse/plugins/org.python.pydev_4.1.1.201505312114/pysrc (OS X example)
C:\LiClipse 2.4.0\plugins\org.python.pydev_4.4.0.201510052047\pysrc (Windows example)
Copy over this entire folder (pysrc) to the VM. The easiest way to copy this over to your VM is by using the VM’s shared folder. Assuming your shared folder is at: ~/development/openstack/vagrant-swift-all-in-one/
$ cp -r /opt/homebrew-cask/Caskroom/liclipse/2.1.0/liclipse/plugins/org.python.pydev_4.1.1.201505312114/pysrc/ ~/development/openstack/vagrant-swift-all-in-one/pydevThis copies the pysrc folder over to a folder named pydev on the VM.
SSH into your VM, and make sure the pysrc folder shows up. For me, the shared folder is mapped to /vagrant, so I see it at /vagrant/pydev
In order to make this accessible to Python on the VM, you need to add it to your $PYTHONPATH environment variable. While SSH’d into the VM, add it to the $PYTHONPATH using a command like this: (Assuming the PyDev source you copied over is at /vagrant/pydev on the VM)
$ export PYTHONPATH="$PYTHONPATH:/vagrant/pydev"Hello, Remote Python Debugging
Before diving into Swift code and debugging it, let’s debug a simple Python script running remotely on our VM to make sure everything works. Make sure the debug server is running on your local machine (you should see “Debug Server at port: 5678” in the LiClipse console)
Create a script at ~/test-script.py with the following contents, but replace <YOUR LOCAL MACHINE IP HERE> with the IP you found above. In my case, it was 192.168.8.1. Try the VirtualBox VM IP address first; if it doesn’t work, then use your local machine’s “regular” IP address.
#!/usr/bin/env python

import pydevd
pydevd.settrace('<YOUR LOCAL MACHINE IP HERE>', port=5678)

a = 1
b = 2
c = a + b

s = 'hello world'
print s
The first two lines are the how the debug breakpoint is set. Note that this means the code you want to debug must be modified by adding these two lines! These two lines basically connect to the remote debug server (running on your local machine) and allow control through the LiClipse user interface. Note that this is very much different from Java remote debugging, where you don’t need to modify the target code.
Now, make the script executable:
$ chmod u+x test-script.pyAnd run it:
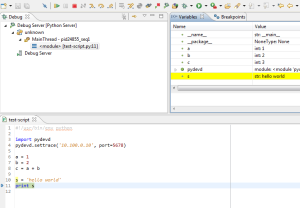
$ ./test-script.pyAfter running this, you should see the Debug Server show the thread and script in the Debug view. You can now step through the code and inspect the variables. The buttons at the top of the screen are for Step Into (F5), Step Over (F6) and Step return (F7). If you’re familar with debugging, these should make sense.
The Variables view shows the state/value of the variables currently defined. You can step through some lines of code (F6) and see how the values change. You can even modify a value while the code is stopped. (Note that the values shown in the Variables view show the type as well, like str: hello world, but when you edit a variable, you should just use the literal value, i.e. 'hello world')
You can click the Resume/F8 button at any time to return control to the program, and it will execute normally.
Remote Debugging Swift Code
Now that you’ve debugged a simple Python script remotely, let’s move onto the Swift code. Unfortunately, there is another change we need to make to Swift code before we can debug into the code. The PyDev debugging does not play well with green threading, so we’ll need to temporarily disable that in order to get debugging to work. This is obviously not an optimal solution, but I have not yet found a better way around this.
Open up swift/common/wsgi.py and find the line like this: (It should be around line 411)
eventlet.patcher.monkey_patch(all=False, socket=True, thread=True)Change the line to this:
# TODO: Disabling eventlet green threading to allow for PyDev debugging to work.
#eventlet.patcher.monkey_patch(all=False, socket=True, thread=True)
eventlet.patcher.monkey_patch(all=False, socket=True, thread=False)
This disables green threading. If you don’t do this, the remote debugging will not work properly.
I’ll debug a sample functional test. Open up swift/common/middleware/slo.py and browse to StaticLargeObject.__call__() and add in a breakpoint here right at the beginning of the method:
def __call__(self, env, start_response):

    import pydevd
    pydevd.settrace('<YOUR LOCAL MACHINE IP HERE>', port=5678)

    """
    WSGI entry point
    """
    ...
Restart Swift for the changes to take effect:
$ swift-init main restartNow, change directory to swift/test/functional and run a simple functional test that hits the SLO code:
$ nosetests --exe -s tests.py:TestSlo.test_slo_get_simple_manifestYou should see Debug Server show the call/stack trace in the Debug view, as well as the line in StaticLargeObject.__call__() highlighted where the remote breakpoint was hit. You will have to hit “Resume”/F8 a whole bunch of times to get through the test, since this method is invoked many times because it’s in the request pipeline.
Unfortunately, if you disconnect the debug server before resuming, Swift may hang and you’ll have to run swift-init main restart to get things back to normal. Because of this, you’ll want to set breakpoints to very specific areas of code so you don’t have to resume too many times like in the example above. I have not yet found a way to set conditional breakpoints, i.e. breakpoints that only fire when a variable has a certain value, but being able to do this would help.
Conclusion
Remote debugging in Python is a little more involved, but well worth the effort as it can offer much more insight into why something bad is happening, versus the alternative of just putting a bunch of logging statements everywhere. Please leave a comment below if you have any suggestions for improvements. Thanks for reading!
References
- http://www.pydev.org/manual_adv_remote_debugger.html
- http://www.liclipse.com/
- https://www.jetbrains.com/pycharm/help/remote-debugging.html
- http://stackoverflow.com/questions/6989965/how-do-i-start-up-remote-debugging-with-pycharm
- http://docs.openstack.org/developer/swift/development_saio.html
- https://github.com/swiftstack/vagrant-swift-all-in-one
- http://www.pydev.org/download.html
- http://www.liclipse.com/download.html
- https://github.com/caskroom/homebrew-cask/blob/master/Casks/liclipse.rb
- http://ilearnstack.com/2013/05/30/debug-openstack-code-local-remote-with-eclipse-and-pydev-plug-in/
- https://ask.openstack.org/en/question/2997/debugging-openstack-swift-with-eclipse-and-pydev/
- https://github.com/openstack/swift/blob/master/swift/common/wsgi.py#L411


